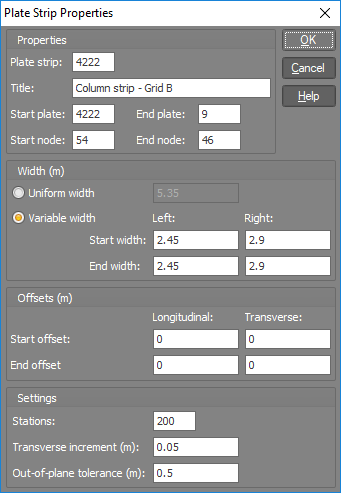
Plate strips
Plate strips can be drawn anywhere across a surface that has been modelled
with plate elements, and then displacement diagrams, bending moment diagrams,
shear force diagrams, axial force diagrams and stress diagrams can be
displayed along the strip. Strips can have a uniform width or can be tapered.
For detailed information about plate strips refer to "Plate
strip data".
Creating a new plate strip
In order to create a new plate strip you can either click the plate
strip draw button  in the top
toolbar or from the Structure menu select "Plate strips" =>
"Draw Plate Strips". It is then just a matter of drawing the
strip between two nodes that define its ends. The plane of the strip is
defined by the plane of the plate element attached to the strip's start
node. If there is more than one plate element attached to the start node
then you can select the one you want to use by hovering over it until
it highlights before you click the start node to start drawing.
in the top
toolbar or from the Structure menu select "Plate strips" =>
"Draw Plate Strips". It is then just a matter of drawing the
strip between two nodes that define its ends. The plane of the strip is
defined by the plane of the plate element attached to the strip's start
node. If there is more than one plate element attached to the start node
then you can select the one you want to use by hovering over it until
it highlights before you click the start node to start drawing.
New strips default to a width of 1m if metric units are used or 3ft
if Imperial units are used, and so after drawing a strip you should edit
it to change the width, offsets and other parameters to suit your exact
requirements.
Editing a plate strip
You can edit a plate strip either by double-clicking it or by selecting
it and then right-clicking followed by selecting "View/Edit Plate
Strip Properties (Form)" from the popup menu that appears. The plate
strip properties form that appears below is fully explained in "Plate strip data".
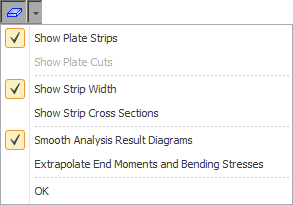
Viewing plate strips
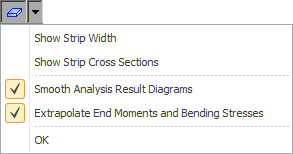
You can view plate strips by clicking the "Show Plate Strips/Cuts"
button  near the top of the side toolbar. By default
the strip centerline and its width are shown visually, however you can
also show strip profiles (cross sections) by clicking the arrow next to
the main button.
near the top of the side toolbar. By default
the strip centerline and its width are shown visually, however you can
also show strip profiles (cross sections) by clicking the arrow next to
the main button.
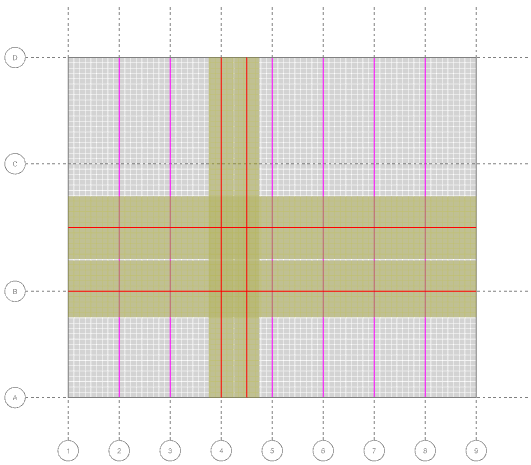
The following image shows typical column and middle strips drawn in
two directions on a reinforced concrete slab.
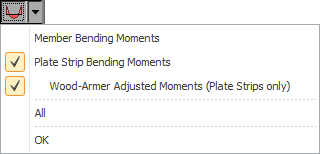
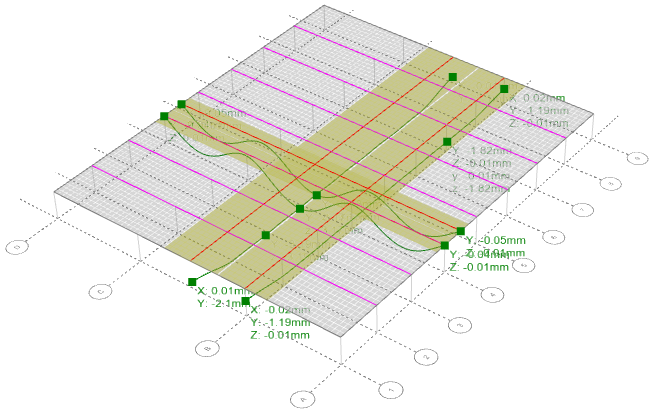
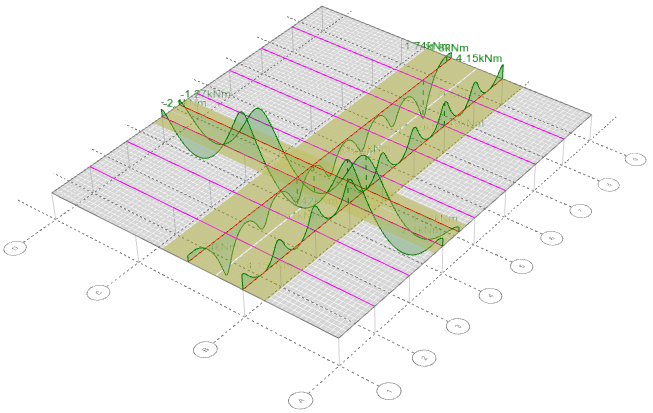
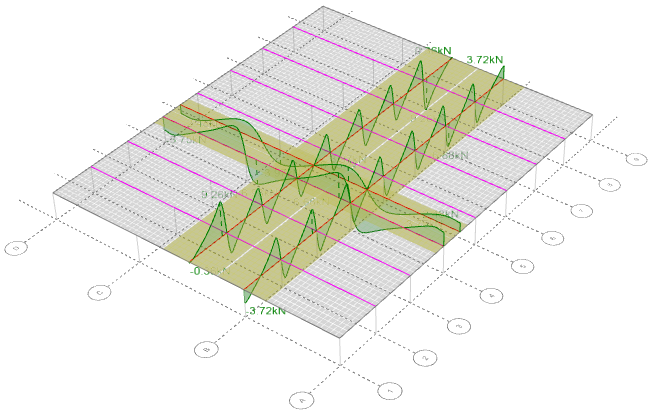
Analysis diagrams
If plate strips are visible then you can show their displacement, bending
moment, shear force, axial force and stress diagrams by clicking the desired
 ,
,
 ,
,
 ,
,
 or
or  button on the side toolbar. The bending moments, shear forces, axial forces
and stresses along the strip are calculated by aligning and integrating
the values from the underlying plate elements, whereas the displacements
are obtained from the maximum
of the displacements across the width of the strip at each station
along the strip.
button on the side toolbar. The bending moments, shear forces, axial forces
and stresses along the strip are calculated by aligning and integrating
the values from the underlying plate elements, whereas the displacements
are obtained from the maximum
of the displacements across the width of the strip at each station
along the strip.
Out-of-plane and in-plane shear force diagrams are selectable via the
 and
and  buttons, where the button shows out-of-plane shear
forces and the button shows in-plane shear forces.
buttons, where the button shows out-of-plane shear
forces and the button shows in-plane shear forces.
Wood-Armer
bending moment adjustment
In order to take into account the effect of twisting on the bending
moments in the strip, a bending moment diagram adjusted using the Wood-Armer
method can also be displayed. Depending on the twisting moment, the Wood-Armer
adjustment generally increases the positive and negative moments. The
procedure for adjusting My (the moment about an axis across the strip)
is as follows:
1. For each station along the strip the Mx, My and Mxy values
are summed from the plate elements across the strip to obtain a single
Mx, My and Mxy value at the strip station.
2. For bottom reinforcement, if Mx > -|Mxy| then My = My +
|Mxy|, otherwise My = My + |Mxy2/Mx|.
In either case My >= 0.
3. For top reinforcement, if Mx < |Mxy| then My = My - |Mxy|,
otherwise My = My - |Mxy2/Mx|.
In either case My <= 0.
This has the effect of amplifying the positive and negative moments.
For more information refer to "Sign
conventions".
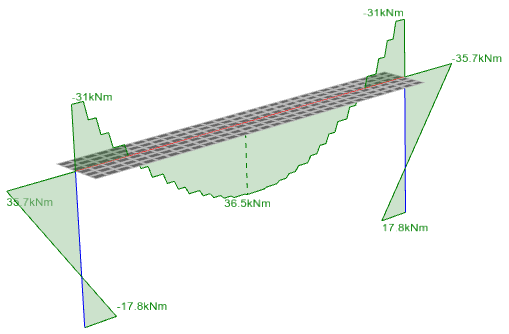
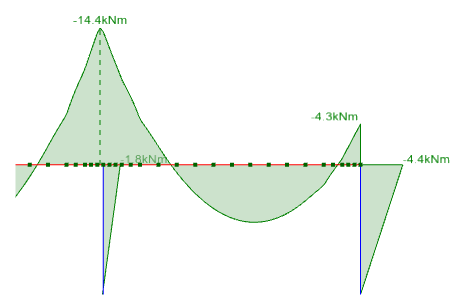
The following diagrams show examples of deflections, bending moments
and shear forces.
Smoothing Analysis Diagrams
If smoothing is turned off then the plate strip values are calculated
based on the raw plate element data.
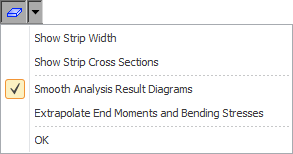
This usually results in strip diagrams that have some stepping in them
rather than being smooth curves. If smoothing is turned on then interpolation
is performed between the plate element values, resulting in much smoother
plate strip diagrams. It is a good idea to compare the smoothed and unsmoothed
diagrams to ensure that their values are comparable. If
there is a significant discrepancy between the smoothed and unsmoothed
diagrams then in most cases it is safer to use the unsmoothed values.
If you see unexpected peaks or jumps in a plate strip diagram then this
could indicate that the transverse increment needs to be reduced in order
to provide more data sampling points for the diagram. This can be particularly
evident in diagrams that aren't smoothed.
Underestimation of peak bending moments and bending
stresses
When viewing plate strip bending moment or bending stress diagrams,
because they are calculated from just one value per plate element, the
moments and bending stresses at the very ends of the strip may be underestimated
if the ends of the strip coincide with the edges of the wall or slab being
modelled. This is because the end values are based on results that come
from half a plate element width in from the ends.
Consider the following example which shows a slab strip modelled with
plate elements and supported on columns at each end.
The bending moment diagram is unsmoothed and that's why you can see
steps in the diagram that coincide with the rows of plate elements. You
can also see that the end moments in the strip are underestimated compared
to the column moments. This is because bending moments are only available
at the center of each plate element rather than the edges. Turning on
smoothing will remove the stepping, however it won't solve the problem
of the end moments being underestimated.
One solution to this is to tick the "Extrapolate End Moments and
Bending Stresses" option to have the end values extrapolated based
on values from plate elements that are further in from the ends.
The following diagrams show the effect of smoothing and extrapolating
on the above example.
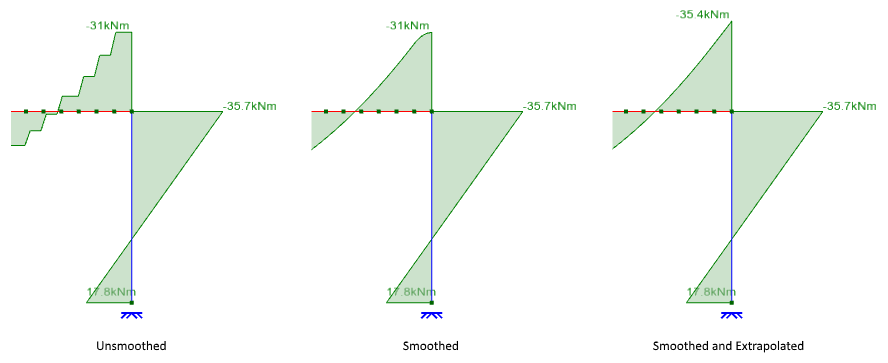
You can see that extrapolating the end values gives a very good result
in this case, however you must
always check after extrapolating to make sure that the adjusted end values
look correct before you rely on them or use them in a design.
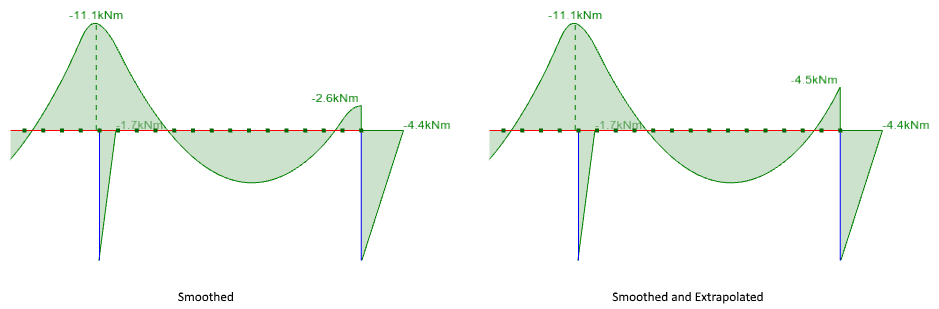
Note that a similar underestimation of peak bending moments can also
occur away from the ends where a column or beam provides support to an
internal point along the plate strip. However as you can see below, while
extrapolating greatly improves the end values, it does not change the
internal peak bending moments.
In order to improve the accuracy of internal peak moments (or end moments
if extrapolation doesn't work well) the solution is to refine the plate
mesh around the problem areas. The diagram below shows the result of reducing
the mesh size at the internal support and ends.
It is
strongly recommended that you always check the plate strip bending moment
and bending stress diagrams carefully and then use smoothing, extrapolation
and/or refined meshing if necessary to achieve accurate results. Don't
just use the plate strip diagrams without checking them first.
Multiple load
cases
If multiple load cases are selected then
a separate plate strip diagram is shown for each load case. If enveloping
is turned on then the plate strip diagrams show the minimums and/or maximums
from the selected load cases.
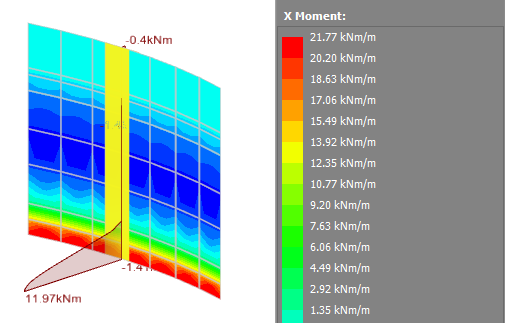
Out-of-plane tolerance
The "Out-of-plane" tolerance setting
is very important to get right if you have a plate strip on a surface
that isn't completely flat. In the following example we have a 1m wide
vertical plate strip on the wall of a circular tank for which the contour
diagram is indicating a moment at the bottom of 21.77 kNm/m. For our 1m
wide strip we are expecting a moment at the bottom of 21.77 kNm, but the
bending moment diagram is showing only 11.97 kNm, about half of what we
are expecting.
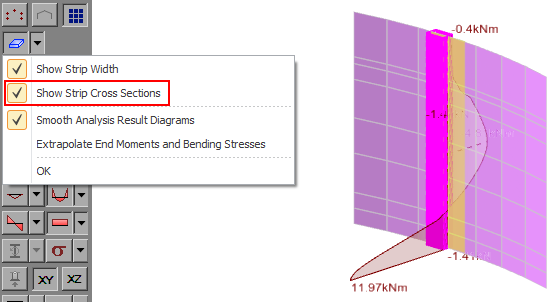
If we turn on the plate strip cross sections
you can see that only half of the strip is active, indicating that not
all the underlying plate elements are contributing to the bending moment
diagram. In this case it is occurring because the plate elements in one
half of the strip are in a slightly different plane to the ones in the
other half due to the curvature of the tank wall.
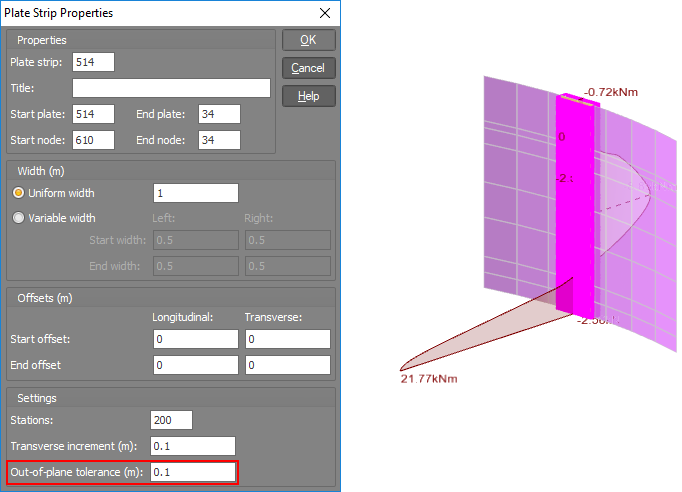
If we increase the out-of-plane tolerance
to allow for this then the plate strip shows the expected result.
This
illustrates that when you have a plate strip on a surface that isn't completely
flat, it is very important that you turn on the strip cross sections to
check that all of the strip is active before you accept its results.
See also Plate strip data.
See also Plate strips text.
See also View plate strips.
See also Datasheet Input.