
In order to perform a harmonic response analysis, you must first create one or more harmonic load cases. A harmonic load case contains information about the vibrating load source, the problem type, mass load case, load factor, frequency and phase. You can also define a factor versus frequency table that is used if you choose frequency sampling in the harmonic analysis. Harmonic load cases can be combined in combination load cases, and multiple harmonic load cases can be analysed simultaneously.
![]() The
mode shapes must have been calculated from a dynamic frequency analysis
before the harmonic response analysis can proceed.
The
mode shapes must have been calculated from a dynamic frequency analysis
before the harmonic response analysis can proceed.
For an overview of harmonic response analysis, refer to "Harmonic response analysis".
Case
This is the harmonic load case. If you want to combine vibrating loads that have different problem types, factors, frequencies or phases into a single harmonic load case then you can do it by simply adding extra lines to the datasheet that have the same harmonic load case number. In the datasheet example shown above you can see how load sources with different frequencies have been combined into harmonic load case 11. Any lines with duplicate harmonic load case numbers can have different source load cases, problem types, base loads, factors, frequencies and phases. The harmonic analysis will simply combine the effects of the duplicate lines for each harmonic load case.
You can also combine harmonic load cases with other harmonic load cases by the use of combination load cases.
Combining harmonic and static results
In order to combine harmonic analysis results with static analysis results, you should use the "Generate dynamic response step load cases" tool. It allows you to convert selected steps from the harmonic analysis into harmonic step load cases and then combine them with the static or other load cases. For example, if you wanted to combine the results of harmonic load case 11 with static load case 4, you could run the harmonic analysis, decide which steps were important, convert them to step load cases of say 101 to 115, and create combination load cases of say 201 to 215 which combined step load cases 101 to 115 with static load case 4 (ie. comb 201 = 101 + 4, comb 202 = 102 + 4,... etc).
You can also combine harmonic analysis results with spectral or transient analysis results by using the same procedure as above.
Note that creating or editing combination load cases manually using the combination load cases datasheet will cause the harmonic step load cases and their combinations to be deleted and so if this happens you will have to re-create them using the "Generate dynamic response step load cases" tool.
If you have a combination load case that combines static load cases with step load cases from a harmonic response analysis then you must carefully check that the harmonic step load cases actually exist before you use the results of the combination. If the harmonic step load cases have been deleted (due to a model, load or mass change or a re-analysis) then the combination may just contain the results of the static load cases. Because SPACE GASS allows combination load cases to include non-existent load cases, it doesn't give any warnings or errors if the harmonic step load cases are missing. It can't even detect that they are missing because they have no input data associated with them. One way for you to quickly check if combination load cases contain harmonic analysis results is to look for "harmonic" in the load case heading in analysis result reports (eg. "Load case 301 (LinComb+Harmonic)" or "Load case 302 (Harmonic)").
You can also include a static load case in a harmonic load case by adding it as a separate line in the harmonic datasheet and giving it a frequency of 0Hz and a phase of 90°. It will be applied as a static load and combined with any other harmonic loads that are in the same harmonic load case. The 0Hz frequency means that its magnitude won’t vary with time and the 90° phase coincides with a peak in the harmonic sine wave, meaning that the static load’s full magnitude will be applied. Note that any harmonic loads with a zero frequency will be applied if time sampling is selected but ignored with frequency sampling.
Source case
If your harmonic load source comes from vibrating loads located at nodes on the structure then the source case is the load case number of those node loads. If your harmonic load source comes from base displacements, velocities or accelerations then the source case is not required and is disabled in the datasheet. Member and plate loads in the source load case are not used in the harmonic response analysis.
The source case can be a primary or combination load case.
Problem type
The problem type can be "Applied loads", "Base displacement", "Base velocity" or "Base acceleration". Each of these load types is assumed to be vibrating in a harmonic (sinusoidal) motion with a specific frequency and phase.
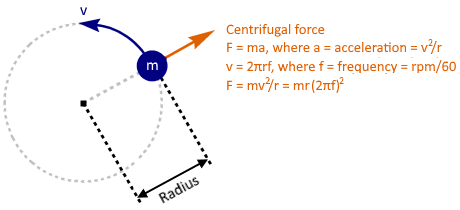
"Applied loads" is typically used to model the effect on the structure of vibrating machines such as a vibrating screen, crusher, pump, motor or any out of balance rotating or oscillating mass. It can also be used to model the effect of walking excitation or vehicular traffic. The dynamic force of such a vibrating load source is its mass multiplied by its maximum acceleration. For example, a mass m rotating around a circle of radius r at a frequency of f has a dynamic force equal to ma = mr(2pf)2. This is also equal to its centrifugal force. Similarly, a mass m moving linearly in harmonic motion (eg. like a piston) over a travel distance of 2r at a frequency of f also has a dynamic force of mr(2pf)2.
Because vibrating loads oscillate from one side to the other there is no
need to input them as both positive and negative.
If your loads are vibrating at some angle to the global axes then you must
calculate their global components and apply them in each of the global
directions.
Mass case
This is the mass case that was used in the dynamic frequency analysis on which the harmonic analysis is based. You can choose a different mass case for each harmonic load case.
The mass case can be a primary or combination load case.
Rotation node
This is reserved for future use.
Base disp/vel/acc
If your harmonic load source comes from a base displacement, base velocity or base acceleration then you must define this directly in the datasheet rather than as node loads. They could be used to model the effect of something like a shaker table or an ocean wave, where the restrained nodes are the vibration source. Base loads are assumed to be varying with time in a sinusoidal fashion. They cause all of the base (restrained) nodes to vibrate in unison (ie. with the same frequency, amplitude and phase).
The displacements, velocities and accelerations obtained from a harmonic analysis using a base load source are relative to the base (restrained) nodes, and so if you want to obtain the net displacements, velocities or accelerations then you need to superimpose the base displacements, velocities or accelerations on the reported values, taking into account the phase difference between them. For example, if the reported accelerations are out of phase with the base accelerations by 180deg (ie. in opposite directions) then the net accelerations would be the difference between them rather than their sum.
Factor
This is a load factor that is applied to the harmonic load source to factor its magnitude up or down. For frequency sampling, if both a load factor and a factor versus frequency table have been defined then they are multiplied together and their product is applied to the vibrating loads.
These are the frequency (in Hz) and phase (in degrees) of the vibrating load source. If you have multiple load sources with different frequencies or phases that you want to combine into a single harmonic load case then you can do it by adding them in extra datasheet lines that all have the same harmonic load case. For example, in the datasheet shown at the top of this page, you can see that load case 11 contains loads from node load case 2 vibrating at 3Hz plus loads from node load case 5 vibrating at 1Hz.
A harmonic load source vibrates in accordance with sin(wt+f), where w is its circular frequency (equal to 2pf), t is the elapsed time and f is the phase. At time t=0, the sinusoid starts at zero (ie. sin(0)=0) unless adjusted by the phase. A positive phase has the effect of making each oscillation happen sooner, whereas a negative phase delays the oscillations. A phase of 360 degrees represents one full oscillation of the load source.
If you only have a single harmonic load source then setting its phase to advance or delay the oscillations is meaningless, however if you are combining multiple load sources in a harmonic load case then setting their phases is important because the phases affect how the load sources interact with each other. For example, if you have two load sources that are vibrating at the same frequency and are "in phase" then they will reinforce each other. If they are out of phase by 90 degrees with respect to each other then one will reach its peak or trough at the same time as the other passes through zero. If they are out of phase by 180 degrees then they will oppose each other.
Note that the oscillations of the structure generally lag behind the oscillations of the vibrating load source by an amount known as the "phase lag". If the frequency of the load source is low compared to the significant natural frequencies of the structure then the phase lag is small and the structure is close to being "in phase" with the load. If the frequency of the load source is high then the phase lag increases up to a maximum limit of 180 degrees at which point the structure and load are fully "out of phase". If the movement of the structure appears to start in the wrong direction then it is most likely due to phase lag.
Refer also to applying a harmonic load with zero frequency under “Combining harmonic and static results” above.
Load category
The load category column lets you specify which load categories the loads will go into. For more information refer to "Load categories".
Factor vs frequency table
Factor versus frequency tables are not used with time sampling, however for frequency sampling they can be used to factor the magnitude of the vibrating loads as the frequency changes. If no factor versus frequency table is defined then all frequencies have the same load factor applied. If both a load factor and a factor versus frequency table have been defined then they are multiplied together and their product is applied to the vibrating loads.
Each line in the datasheet that contains a factor versus frequency table has its "Fact vs Freq" button shown colored. This is so that you can identify them at a glance without having to open them to check.

A factor vs frequency table is important if the magnitude of the load source depends on its vibration frequency. For example, if the dynamic force of a vibrating load is mr(2pf)2 (as discussed in "Problem type" above) then as the frequency changes during the frequency sampling, the dynamic force varies in proportion to f2. If you had input the dynamic force of a particular vibrating load source based on a frequency of 3.5Hz for example, then for frequency sampling you would need to create a factor vs frequency table based on the equation Factor = (f/3.5)2.
To create such a table you should click the "Factor vs Frequency" button in the datasheet to display the table editor. For simple tables you can just enter values into the grid on the left as shown below. In this particular example, the load factor varies from 0.8 for f=2.5Hz to 1.35 for f=10Hz. For any frequencies outside of 2.5Hz to 10Hz, the load factor is taken as the start or end value in the table. For example, frequencies below 2.5Hz would have a load factor of 0.8 and those above 10Hz would have a load factor of 1.35.

For a table based on an equation such as Factor
= (f/3.5)2,
you should click the  button and then define the equation
in the function editor as follows.
button and then define the equation
in the function editor as follows.

Which generates the following table. You can see that the table ends at 20Hz and so you should ensure that for this particular table the frequency sampling range in the harmonic analysis doesn't go beyond 20Hz, otherwise all frequencies beyond 20Hz will get the factor at the end of the curve of 32.65 in this case. If your frequency sampling range goes beyond what is in the table then you should re-create the table with a wider range of frequencies.

For more information on the table editor and the function editor refer to "Table editor" and "Function editor".