Spectral curve editor
You can open the spectral curve editor by opening the "Spectral Load Data" datasheet from the Loads menu and then clicking the  button (circled in red) in the spectral curve cell or the
  button. If you wish to change the spectral curve for multiple spectral load cases at once then you should select them and then click the button.
You can select the desired spectral curve from the tree in the left-hand window and observe its data values in the right-hand window. You can also click the spectral curve editor button (next to the Ok button) to load and display the spectral curve editor as shown below.
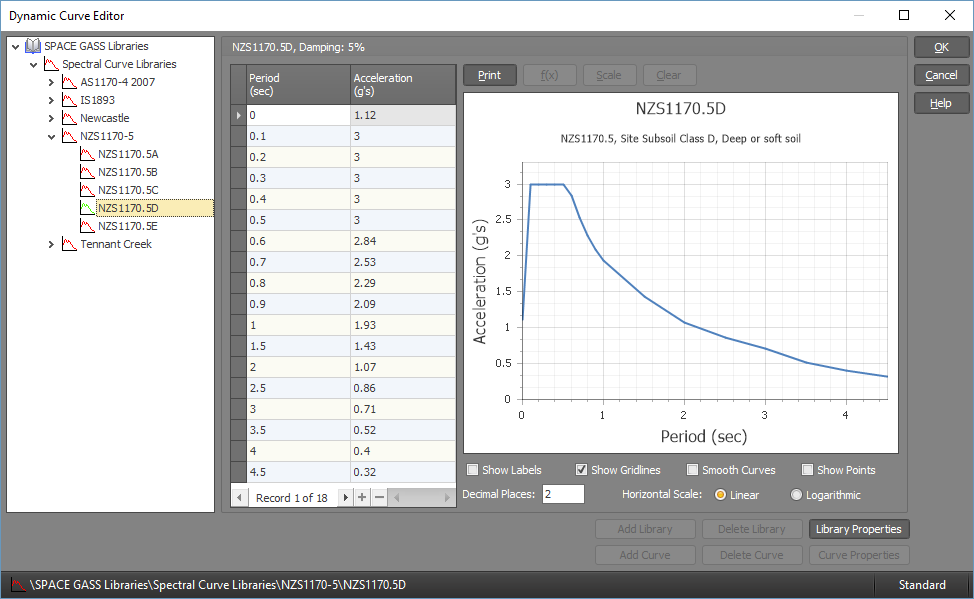
The spectral curve editor can be used to input or edit curves in the spectral curve library. Note, however, that the standard curves supplied with SPACE GASS can’t be changed. The editor allows you to create a spectral curve that will result in the most accurate analysis possible.
Operation of the spectral curve editor is self-explanatory and simply involves selecting a curve name and then inputting or modifying its properties. Each curve contains a set of period versus acceleration pairs, a description and a damping factor.
You can go to a specific point in a curve by clicking near it in the graphics window or by scrolling to and selecting it in the list box. The currently selected point in the list box is highlighted by a small circle in the graphics window. You can add (or delete) points by clicking the buttons below the list box.
See also Standard Libraries for general information about the operation of the library editor.