View dynamic response graphs
After a harmonic or transient response analysis, you can create graphs of displacement, velocity, acceleration or phase versus time (for time sampling) or frequency (for frequency sampling).
In order to generate a graph you should right-click on any node and then select "Harmonic/Transient Response Graph" from the popup menu that appears. You can then click on any other nodes in the structure and the graph will automatically update itself for each node that you click.
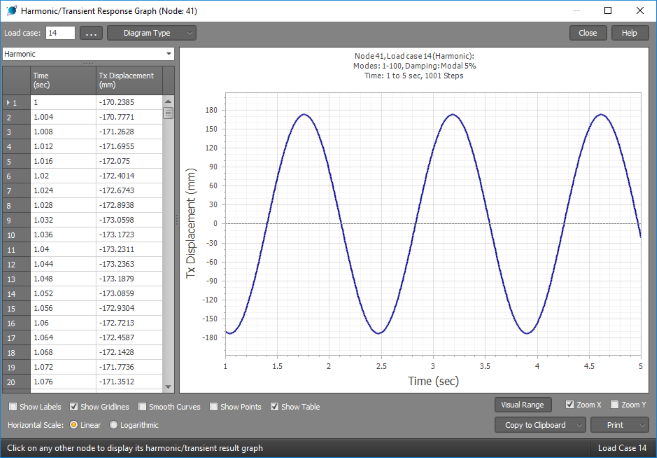
The following graph shows an example of the steady-state displacement versus time response of a particular node to a harmonic load.
The next graph is the displacement versus time response from a transient analysis for a load that is applied and held constant for 25 seconds and then removed.
![]()
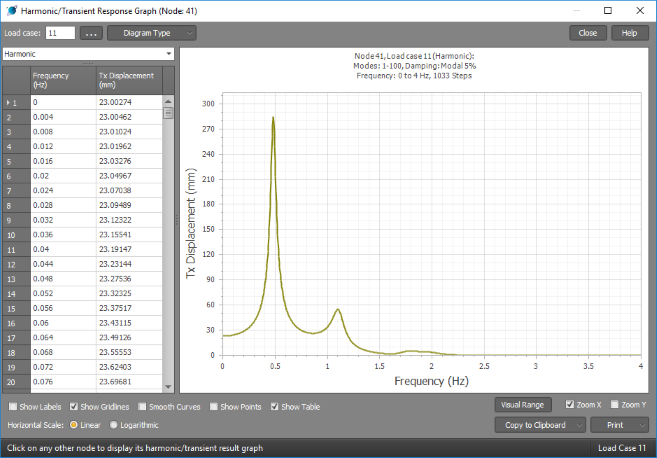
If you have done a harmonic analysis with frequency sampling then you can obtain frequency response (resonance) graphs as shown below.
You can change the load case via the load case selector.

Or change the diagram type via the "Diagram type" button.
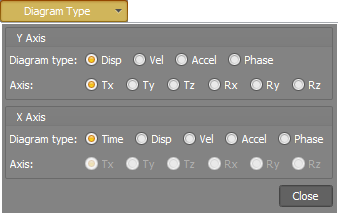
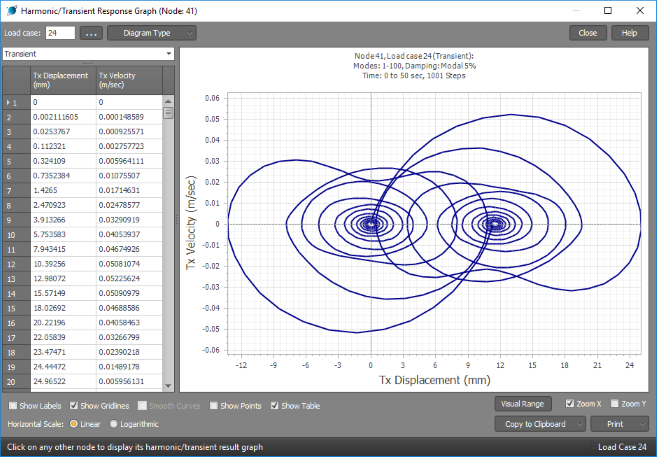
The diagram type selector also allows you to change the time or frequency scale at the bottom to displacements, velocities, accelerations or phases. For example, if you plot velocities versus displacements for the transient response shown above you can get a Poincaré plot like the one below.
Other options at the bottom of the graphs allow you to turn on/off labels, gridlines, curve smoothing, graph points or the numerical table at the left. You can also switch the horizontal scale between linear and logarithmic, set the visual range, zoom in the vertical and/or horizontal directions, copy the graph to the clipboard (for pasting into other programs) or print the graph.
