Buckling analysis results
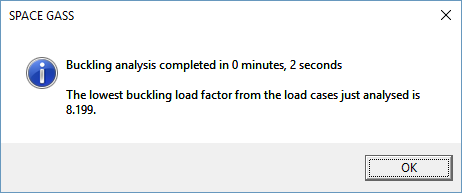
At the end of the buckling analysis, a message showing the lowest buckling load factor is displayed as follows.

This gives an instant indication of whether the buckling capacity of the structure has been exceeded or not. A buckling load factor of less than SF x 1.0, where SF is a suitable safety factor would be unsatisfactory.
Based on the buckling load factor for each load case, a simple formula is then used to calculate the member effective lengths as described in "Buckling effective lengths". The effective lengths can then be automatically transferred into the steel member design modules.
For a more detailed list of the buckling load factors and member effective lengths for each load case, you should view or print a report that includes the buckling load factors and/or buckling effective lengths.
If you get buckling load factors that are below the minimum allowable value (eg. shown as "<0.001" when the minimum allowable value is 0.001), this could indicate an instability problem rather than a buckling problem. It is even more likely to be an instability problem if the low buckling load factors occur in every load case.
By displaying the buckling mode shapes, you can generally see where the buckling would occur, however some models show no movement at all. In these cases, the buckling generally involves node rotations without any translations, making it difficult to see the source of the buckling. The buckling load factor report, however, gives the locations of the maximum node translations and rotations which can help to identify where the buckling is happening.
Load Load Node at Node at |
Case Mode Factor Tolerance Iterations Max Trans Max Rotn |
|
1 1 3.207 0.008 11 4 (X) 3 (Z) |
2 1 0.801 0.008 8 4 (X) 3 (Z) |
In the above example, the buckling mode involves translations in the X-axis direction and rotations about the Z-axis.
If you want to display any higher order mode shapes, just press the +/- keys or press the Shift+PageUp/Down keys or simply type the required mode number (modes 1 to 9).
![]() If
a model appears to buckle in the wrong direction, it is because the buckling
mode shape diagrams are only intended to show the mode of buckling and
not its direction or magnitude.
If
a model appears to buckle in the wrong direction, it is because the buckling
mode shape diagrams are only intended to show the mode of buckling and
not its direction or magnitude.
![]() When displaying the buckling
mode shapes graphically, SPACE GASS makes no attempt to show the member
curvature between end nodes (ie. the node positions are simply joined
by straight lines). You can, however improve the look of the mode shapes
by adding intermediate nodes to the members.
When displaying the buckling
mode shapes graphically, SPACE GASS makes no attempt to show the member
curvature between end nodes (ie. the node positions are simply joined
by straight lines). You can, however improve the look of the mode shapes
by adding intermediate nodes to the members.