Storey shear
When analysing the effect of lateral loading on a multi-storey building due to seismic or wind loads, the storey shear and storey drift graphs tell a useful story. The storey shear graph shows the height-wise distribution of storey shears and lateral forces. A normalized storey shear graph has its shear values divided by the shear that occurs at ground level so that the normalized shear at that level is 1.0. It is therefore important to specify the ground level accurately in the form so that the graph is normalized to the correct shear.
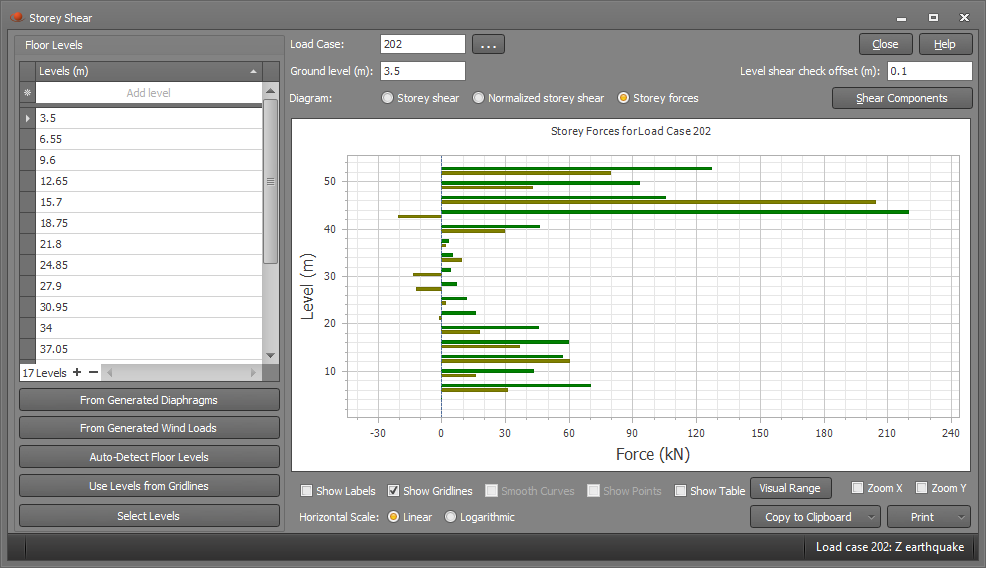
The storey forces graph shows the lateral force that is applied at each floor level, but does not include any lateral forces that are applied to columns or walls between the floors. For a seismic analysis the storey forces come from the lateral acceleration of the masses in each floor.
The stepping that you see in a seismic storey shear graph is due to the lateral forces that are applied at various heights, typically at the floors due to the masses that are concentrated there. Stepping will also occur for wind load cases even if the wind loads have been applied to the walls and columns. Each step represents the change in shear force from a floor to the floor below, and so a shear step includes all the lateral loads that are applied to a floor and to its supporting columns and walls.
Before generating a storey shear graph for the first time, it is a good idea to define the floor levels in the building by using the gridlines tool. This just makes everything clear and means that the storey shear tool doesn't have to scan the model to try to auto-detect the floor levels.
A storey shear graph can be obtained by right-clicking anywhere in the graphics area and then selecting "Storey Shear" from the popup menu that appears. Before the graph can be displayed you need to define the levels at which the shears will be calculated. You can manually enter the floor levels into the "Levels" table or you can click one of the buttons below it to have them transferred in.
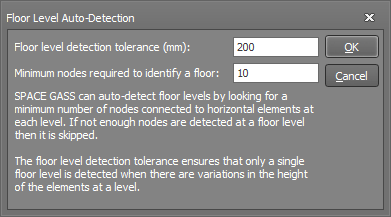
If you have already generated some diaphragms or wind loads then the "From Generated Diaphragms" or "From Generated Wind Loads" buttons transfer the levels used in those tools into the "Levels" table. Similarly, if you have already defined some gridlines then the "Use Levels from Gridlines" button transfers the gridline levels into the "Levels" table. If you want to select the levels graphically then you can click the "Select Levels" button and then click a node at each level to have it put into the table. Finally, the "Auto-Detect Floor Levels" button looks for a minimum number of horizontal elements in a plane that would identify a floor. You can set a tolerance that allows for some variation in the height of the elements, plus you can control how many nodes within that tolerance are required to identify a floor level.
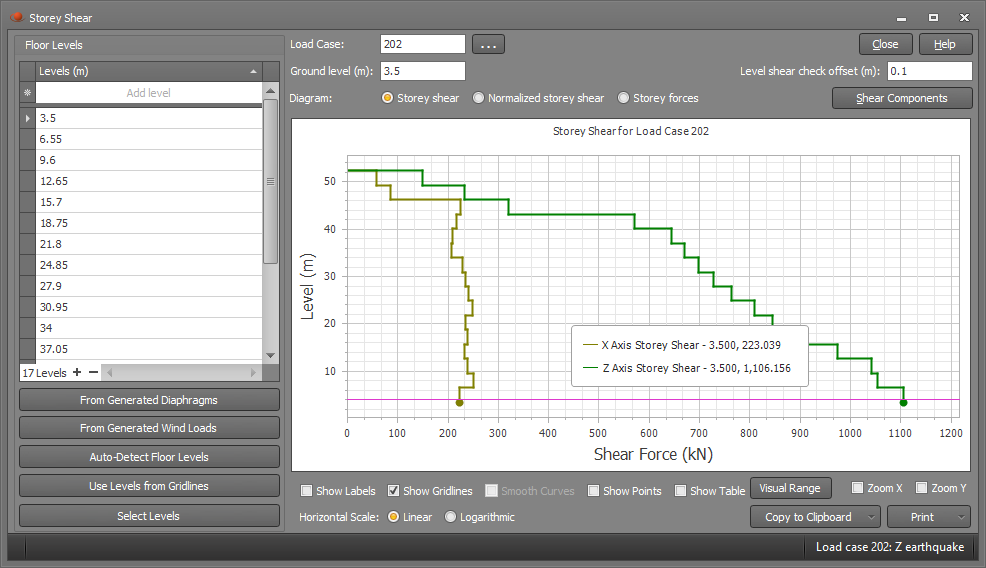
Once the floor levels have been defined and an analysed load case has been selected, the storey shear graph is displayed as follows. The load case chosen for the graph below represents the storey shear for an earthquake in the Z direction and that's why the green Z axis graph has higher values than the X axis graph. If you hover over the graph you can see the tabulated shear values at the cursor location.
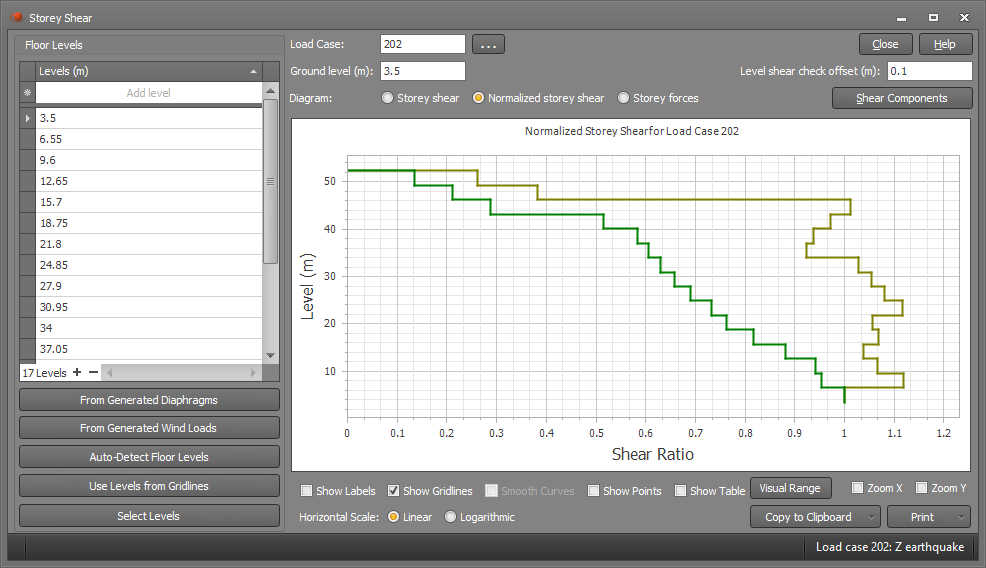
If you choose the normalized graph then it appears as shown below, with the bottom floor shears having values of 1.0. Note that the ground level in this case is at 3.5m and so it's important to specify that correctly in the "Ground level" field, otherwise the graph could be normalized to an incorrect shear.
The storey forces can also be shown as follows.