Table editor
The table editor is used to create factor vs frequency, factor vs time or factor vs position tables for use in the harmonic and transient response analysis modules. It is generally accessed via the harmonic load or transient load datasheets, but you can also get to it via the library editor for tables that are saved to a library.
The following factor vs time table shows an example of a load factor that gradually increases to 1.0 over a period of 5 seconds, holds steady for the next 5 seconds and is then abruptly removed.
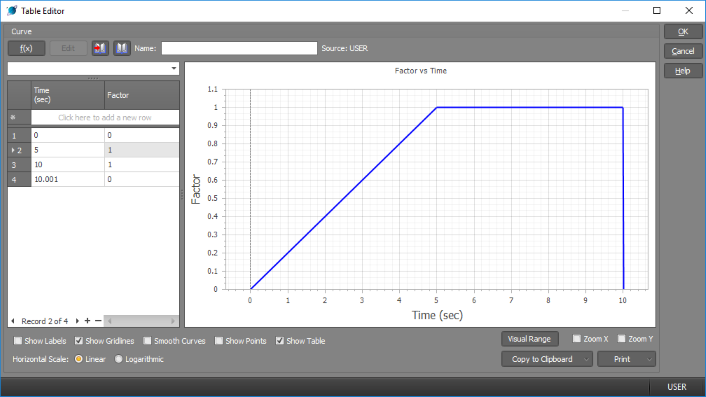
Table extents
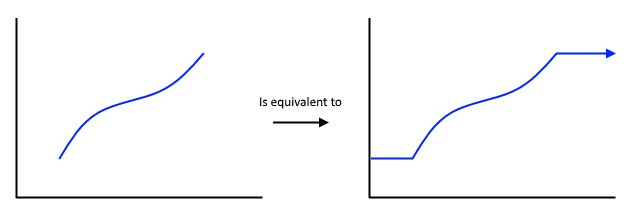
The load factor for any time or frequency value that falls outside the width of the table simply gets the start or end value of the table. This is illustrated in the diagrams below, in which time or frequency values that fall to the left or right of the curve on the left have their load factors determined by the curve on the right.
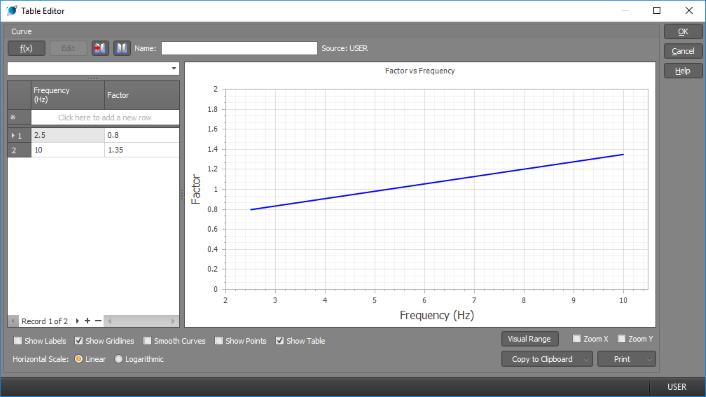
For example in the following table, frequencies below 2.5Hz would have a load factor of 0.8 and those above 10Hz would have a load factor of 1.35.
Function editor
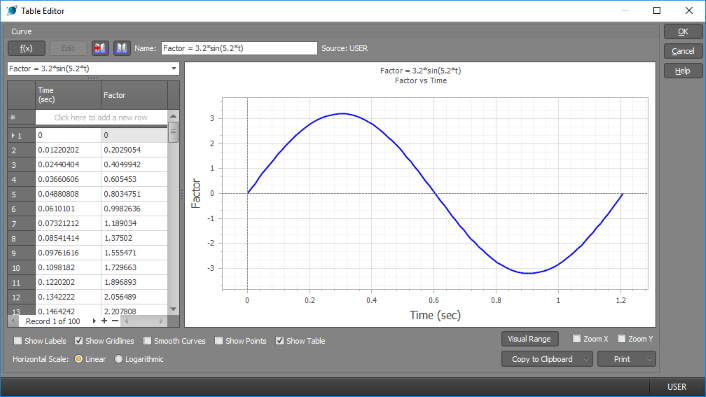
More complicated tables can be created by defining an equation such as a sinusoid or parabola via the function button  that opens the function editor. For more information
on this, refer to the "Function editor".
that opens the function editor. For more information
on this, refer to the "Function editor".
Library tables
For tables that you wish to re-use in other jobs, it is a good idea to save them into a library. You can save a table or recall a previously saved one via the library buttons shown here.

Other options
Other options at the bottom of the table editor allow you to turn on/off labels, gridlines, curve smoothing, graph points or the numerical table at the left. You can also switch the horizontal scale between linear and logarithmic, set the visual range, zoom in the vertical and/or horizontal directions, copy the graph to the clipboard (for pasting into other programs) or print the graph.
