Harmonic response analysis results
A harmonic response analysis calculates the deflections, velocities, accelerations and phases for each time or frequency step. From these results you can animate the structure to see how it responds to the vibrating load sources, obtain graphs of the time-history response or the frequency (resonance) response, convert time or frequency steps into result load cases or obtain reports.
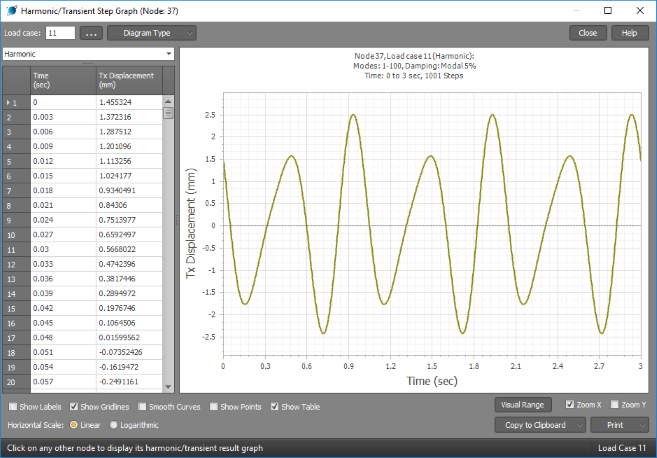
The following graph shows the time-history response of the displacement of a particular node in a structure that has two vibrating load sources with frequencies of 2Hz and 3Hz combined into a harmonic load case. It has been analysed for 100 modes with 5% modal damping. From this graph you can see that the regular oscillatory pattern repeats with a period of 1 second. The 1 second period is the minimum time required for the two load sources to move out of phase with each other and back into phase.
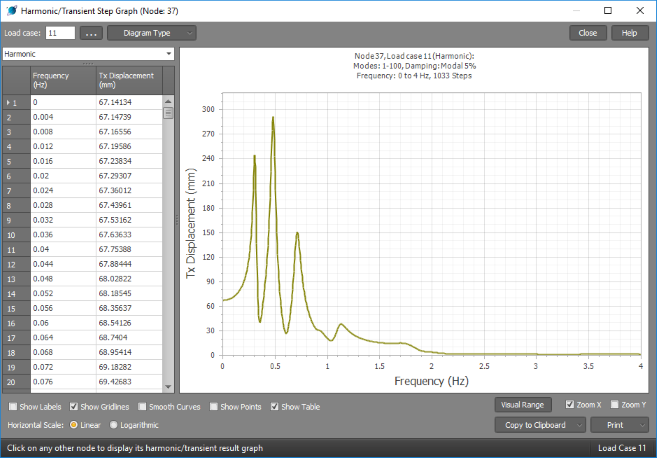
The graph below is the frequency response (resonance curve) for the same node and load case. You can see that the structure has resonant frequencies around 0.3Hz, 0.5Hz and 0.7Hz, as well as some other smaller resonances at higher frequencies. Because the vibrating load sources are well away from the resonant frequencies the maximum displacements are relatively small at around 2.5mm as you can see from the time-history graph above.
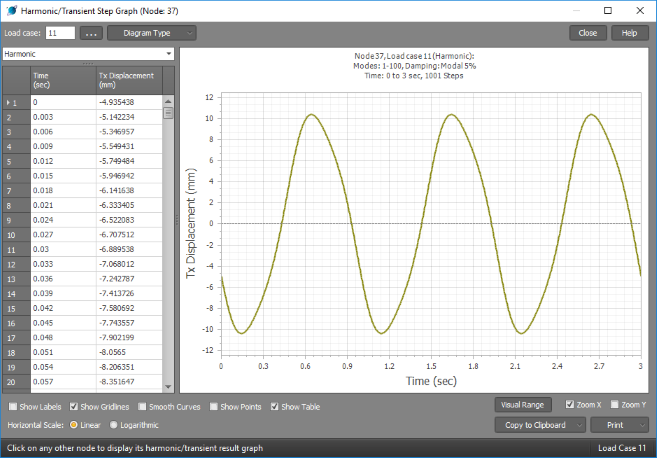
In the following time-history graph, we have changed the frequency of the 2Hz load source to 1Hz without changing its magnitude. You can see that by just changing a load frequency and nothing else, the displacements have gone up considerably from 2.5mm to just over 10mm. This is because the 1Hz load is now closer to a resonant frequency of the structure.
The following report shows the input and output data for the same load case used in the above graphs. You can see from the input data that two load sources have been combined into the harmonic load case with frequencies of 3Hz and 1Hz. The output data includes the mass participation factors (MPFs) and details of the maximum translation, velocity, acceleration and rotation of the structure. You should always aim to get MPFs of 90% or greater in the directions of interest. To achieve higher MPFs you need to include more modes in the analysis.
HARMONIC LOADS (mm,m/sec,g's,Hz,deg)
-------------- (*=Load table applies)
Load Srce Problem Mass X Base Y Base Z Base
Case Case Type Case D/V/A D/V/A D/V/A Factor Freq Phase
11 2 AppLoad 1 1 3 0
5 AppLoad 1 1 1 0
HARMONIC RESPONSE
-----------------
Harmonic case 11:
Mass case: 1
Modes: 100 => 1-100
Damping: Modal (5%)
Sampling: Time (0 to 3 sec)
Steps: 1001
Mass participation: X = 100.000%, Y = 100.000%, Z = 100.000%
Node Axis Step Time Value
Maximum translation 40 X 601 1.8 16.88985 mm
Maximum velocity 40 X 852 2.553 0.1054928 m/sec
Maximum acceleration 30 X 365 1.092 0.753936 m/sec^2
Maximum rotation 43 Y 759 2.274 -0.0050602 rad
Maximum angular velocity 43 Y 344 1.029 -0.0312264 rad/sec
Maximum angular acceleration 43 Y 90 0.267 0.207332 rad/sec^2