Transient response analysis results
A transient response analysis calculates the deflections, velocities, accelerations and phases for each time step. From these results you can animate the structure to see how it responds to the time-dependent load sources, obtain graphs of the time-history response, convert time steps into result load cases or obtain reports.
The following graph shows the time-history response of the displacement of a particular node in a structure that is subjected to a load applied and held constant for 25 seconds and then removed. It has been analysed for 100 modes with 5% modal damping. From this graph you can see that the structure oscillates with an initial amplitude of 25mm, but then gradually settles down to a stable deflection of just under 12mm. When the load is removed at the 25 second mark the oscillations start again and then gradually reduce as the structure settles back to its original "at rest" position.
![]()
The factor versus time table used for the above response is shown below.
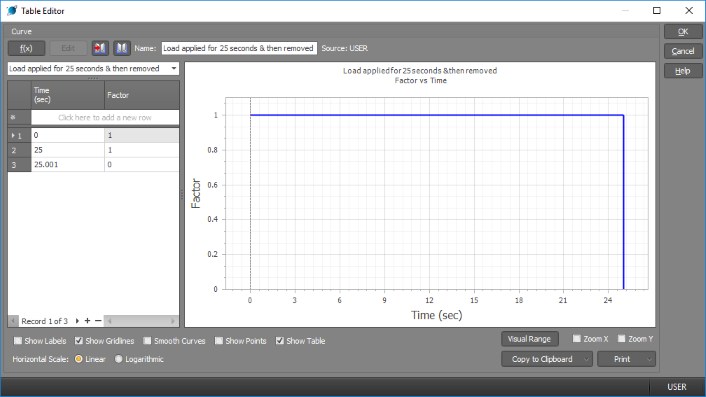
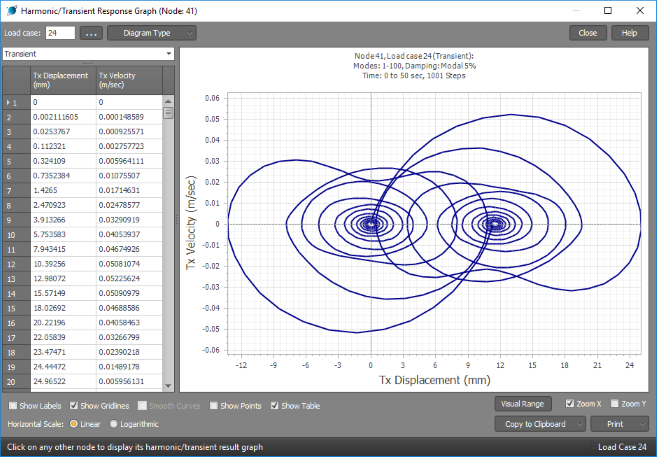
By changing the graph to plot velocity versus displacement we get the following Poincaré plot that shows the two equilibrium positions of the structure clearly at displacements of 0mm and just under 12mm.
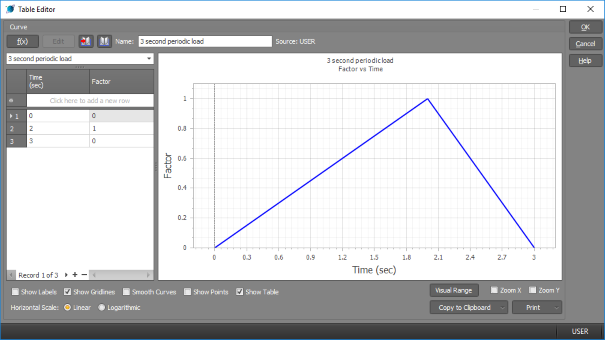
The following graph shows the transient response to a periodic load that has been repeatedly applied with a period of 3 seconds. You can see from the graph that the initial oscillations are irregular while the structure "catches up" to the periodic load before it settles down to a more regular oscillating pattern after about 12 seconds. You can also see that the initial few oscillations have the greatest amplitude and are likely to produce the highest forces and moments in the structure.
![]()
The following report shows the input and output data for the same load cases used in the above graphs. The output data includes the mass participation factors (MPFs) and details of the maximum translation, velocity, acceleration and rotation of the structure. You should always aim to get MPFs of 90% or greater in the directions of interest. To achieve higher MPFs you need to include more modes in the analysis.
TRANSIENT LOADS (g's,Hz,sec,deg)
--------------- (*=Load table applies)
Load Srce Problem Mass X Base Y Base Z Base
Case Case Type Case Acc Vec Acc Vec Acc Vec Factor Freq Period Phase
24 2 AppLoad 1 1*
25 2 Periodic 1 1* 3 0
TRANSIENT LOAD TABLES (sec)
---------------------
Load Srce Problem X-Acc Y-Acc Z-Acc
Case Case Type Time Factor Time Factor Time Factor Time Factor
24 2 AppLoad 0 1
25 1
25.001 0
25 2 Periodic 0 0
2 1
3 0
TRANSIENT RESPONSE
------------------
Transient case 24:
Mass case: 1
Modes: 100 => 1-100
Damping: Modal (5%)
Sampling: Time (0 to 50 sec)
Steps: 1001
Mass participation: X = 100.000%, Y = 100.000%, Z = 100.000%
Node Axis Step Time Value
Maximum translation 37 X 22 1.05 49.82256 mm
Maximum velocity 39 X 509 25.4 -0.0916051 m/sec
Maximum acceleration 28 X 1 0 1 m/sec^2
Maximum rotation 4 X 32 1.55 0.0109202 rad
Maximum angular velocity 2 Z 507 25.3 0.0167413 rad/sec
Maximum angular acceleration 1 Z 1 0 -0.3822172 rad/sec^2
Transient case 25:
Mass case: 1
Modes: 100 => 1-100
Damping: Modal (5%)
Sampling: Time (0 to 50 sec)
Steps: 1001
Mass participation: X = 100.000%, Y = 100.000%, Z = 100.000%
Node Axis Step Time Value
Maximum translation 37 Z 360 17.95 67.56185 mm
Maximum velocity 43 Z 312 15.55 -0.123565 m/sec
Maximum acceleration 37 Z 360 17.95 -0.292955 m/sec^2
Maximum rotation 4 X 360 17.95 0.0193875 rad
Maximum angular velocity 4 X 312 15.55 -0.0362907 rad/sec
Maximum angular acceleration 4 X 361 18 -0.087551 rad/sec^2