Query analysis results
You can query the analysis results graphically in a number of ways as described below:
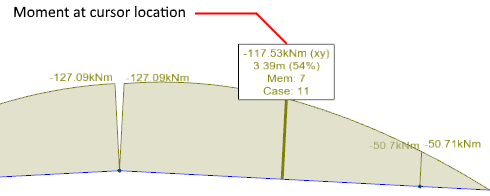
Using the mouse cursor
If you move the mouse cursor onto any load or analysis diagram, the value of the diagram at the cursor position will be shown, together with its location, member number and load case number.
Analysis result querying can be turned on or off by clicking the left hand part of the  button at the bottom of the side toolbar. If the button is on but
analysis results don't appear when you move the mouse over a diagram, click the arrow part of the button and check that the "Analysis Results
Infotips" option is ticked.
button at the bottom of the side toolbar. If the button is on but
analysis results don't appear when you move the mouse over a diagram, click the arrow part of the button and check that the "Analysis Results
Infotips" option is ticked.
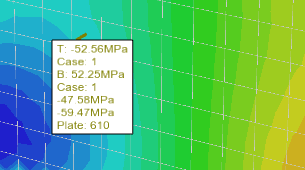
You can also hover the mouse over a plate contour diagram to show the underlying analysis results. In the following example, plate 610 for load case 1 has a stress of -52.56MPa in the top face, 52.25MPa in the bottom face and the point being queried lies in the -47.58MPa to -59.47MPa contour color range.
Using a scrollable window
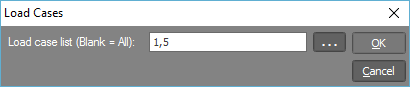
Right-click on any node, member or plate and then select "Analysis Results" from the popup menu that appears. You can then specify the list of load cases that you want to query or just leave the list blank to see the results for all load cases.
The scrollable results form shown below then displays a useful summary of the analysis results for the node, member or plate you selected.
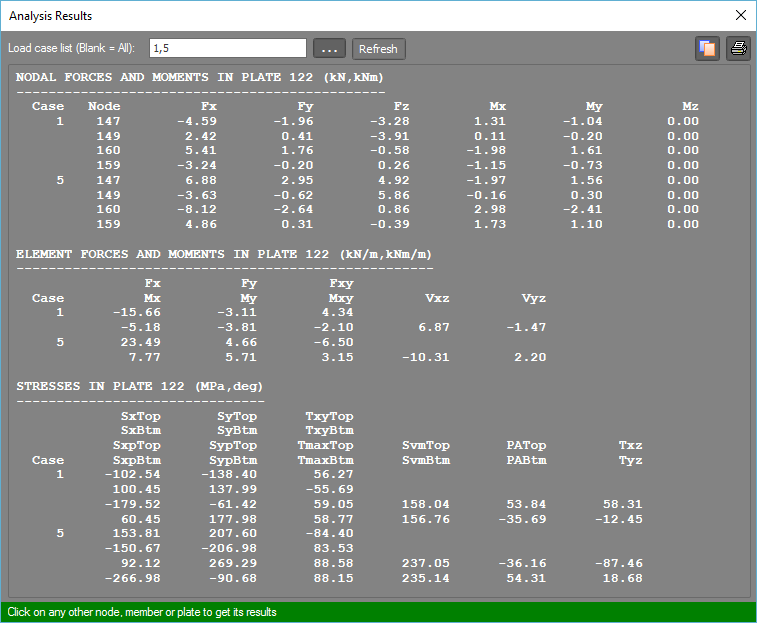
While the form is open, you can simply click on any other nodes, members or plates to have their results displayed.
Enveloped analysis result queries
If you have selected multiple nodes, members or plates then you can get an summary of the enveloped analysis results. After selecting the nodes, members or plates, right-click and then select "Enveloped Analysis Results" from the popup menu that appears.
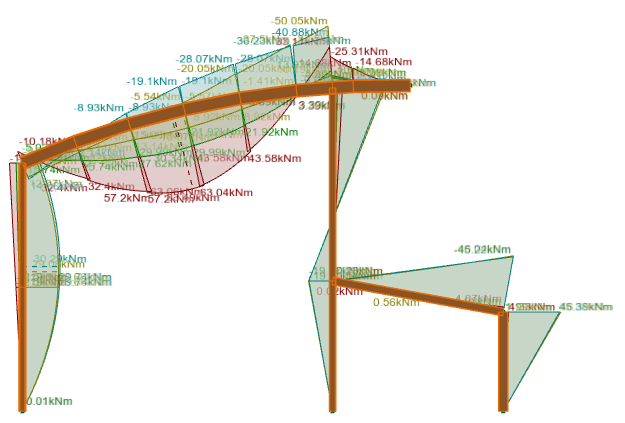
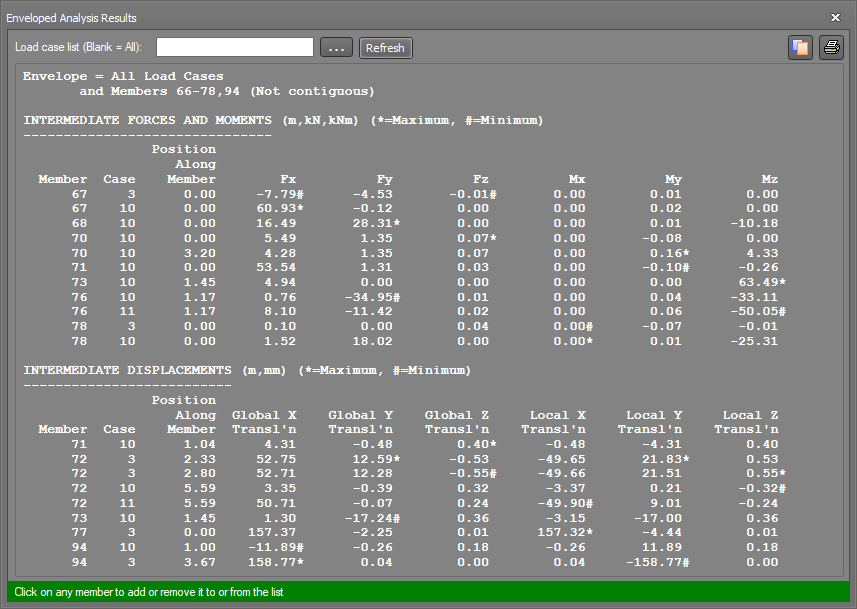
For example, if we select all the members in the following frame that has bending moments displayed and then request an "Enveloped Analysis Results" query, we get a "non-contiguous" summary of the enveloped analysis results shown below. It is "non-contiguous" because the selected members do not form a single line of members connected end to end. In this case the "Position along member" column refers to the position along the particular member that the minimum or maximum value comes from. Enveloped analysis result queries for nodes and plates are always non-contiguous.
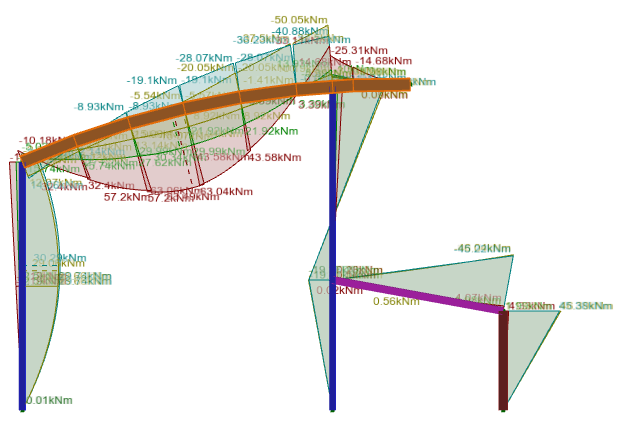
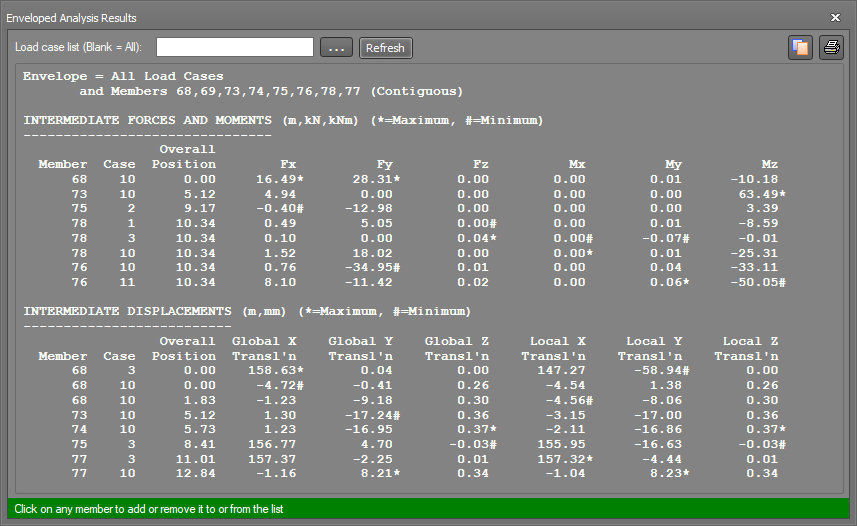
Alternatively, if the selected members are contiguous as in the following example then we get a "contiguous" envelope as shown below. In this case, the "Overall position" column refers to the position from the start of the selected line of members to the minimum or maximum value. The start end of the selected members is defined as the end of the member that was selected first. If you select all the members at the same time using a selection window then the start member will usually be the one with the lowest number.
In order to view an envelope graphically, refer to "View envelope".
To get a fully detailed analysis report, refer to Output.
See also Infotips.