View plate contours
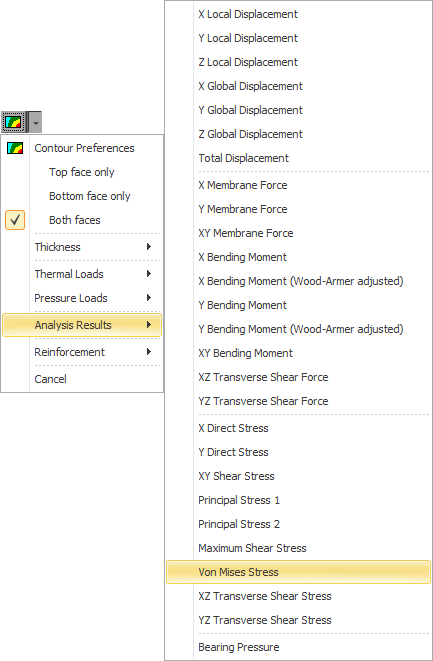
You can show colored contour diagrams for plate thickness, loads, displacements, forces, moments, stresses, bearing pressure and reinforcement by clicking the  toolbar button.
Note that if you try to show contour diagrams for multiple load cases or with enveloping turned on and set to "Both" then you will get contour diagrams drawn on top of each other with confusing colors. If you really want to show contours for multiple load cases or with enveloping set to "Both" then you should also turn on deflections via the  button and the contour diagrams will then be separated and drawn in the deflected position for each load case or min/max envelope. You can then scale the deflected contour diagrams by holding down the "D" key while rotating your mouse scroll wheel in the normal way.
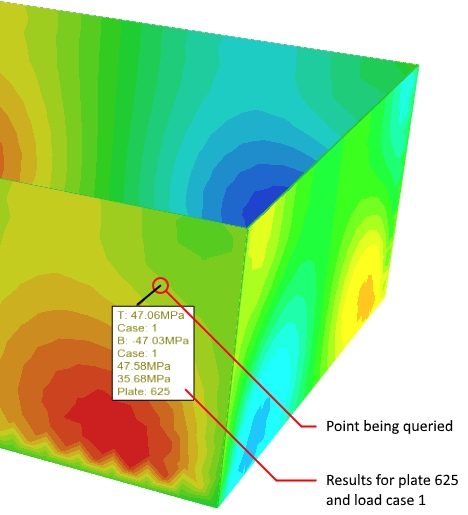
Querying contour diagrams
You can query the contour values by simply hovering your mouse over any plate element. In the following example, the point being queried falls on plate 625, and for load case 1 the plate has a stress of 47.06MPa in the top face and -47.03MPa in the bottom face.
Contour preferences
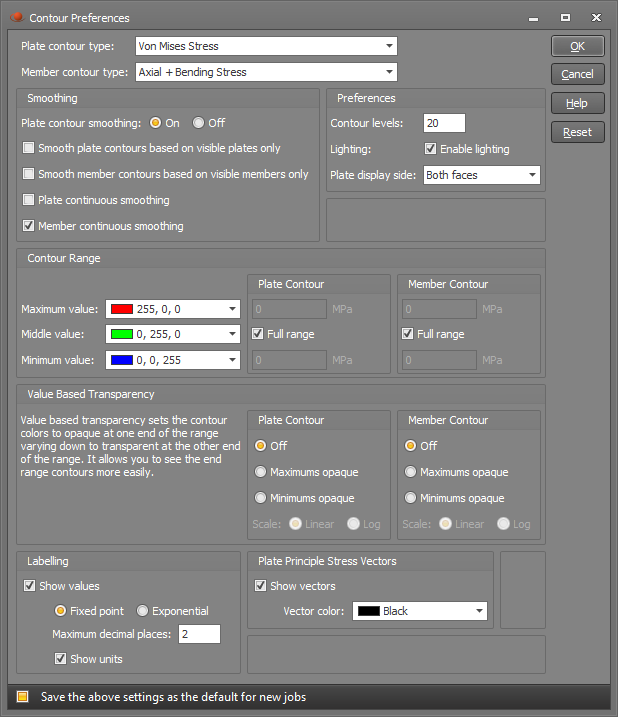
Clicking "Contour Preferences" from the plate contour menu gives you access to the contour diagram settings as follows. You can see that some of the settings apply to member contours which you can ignore when showing plate contours.
Contour diagrams are constructed based on the force, moment or stress values at each node, which are in turn obtained by averaging the values from the plate elements that are connected to the node. For this reason it is important that the local axes in adjacent plates are aligned. If not aligned then the contour diagrams will be meaningless because each value being averaged could be relative to a different set of axes. This is not as critical for the diagrams that are independent of the local axes such as principal stress, maximum shear, Von-Mises stress and out-of-plane displacement. The "Align plate axes" tool can be used to align the plate axes.
Contour smoothing
If contour smoothing is turned on then the contours appear as colored contours rather than a discrete color for each plate element. If the "Smooth plate contours based on visible plates only" option is ticked and a filter is active then any plates filtered out will be ignored when the contour levels are calculated. Otherwise all plates in the model will be used to determine the contour levels. The "Plate continuous smoothing" option lets you switch from a finite number of color levels to an infinitely varying color gradient.
Due to the way the force, moment and stress values are averaged between adjacent plate elements when producing smoothed contour diagrams, inaccuracies can occur in certain areas of the smoothed diagrams, even if the axes of all the plates are aligned. Typically this can happen where plates in different planes meet (eg. where the walls of a rectangular tank meet at the corners) or where thick plates meet thin plates (eg. around the edges of drop panels in a reinforced concrete slab). Because of this it is recommended that you periodically compare the smoothed diagrams with unsmoothed diagrams. Unsmoothed diagrams display the raw result data from the analysis and, although they have a low color resolution, they are unaffected by any shortcomings of the smoothing algorithm. If the unsmoothed diagrams show values that are significantly different to the smoothed diagrams then for safety the unsmoothed values should be used.
Display side
In order to show the results for either side of a panel modelled with plate elements you should rotate the model to see whichever side you are interested in. Some contour diagrams will be the same on both sides (eg. bending moments) and others will be different on each side (eg. membrane stresses). If you want to see the results for one side regardless of which side you are looking at then you can select "Top face only" or "Bottom face only" in the contour button menu or in the "Display side" field. For example, if you want to show the contour for the bottom face while looking from a plan (top) viewpoint then you could select "Bottom face only". Note that the "top" face is defined as being on the side of the positive local z-axis of a plate element. This means that if the local z-axes for your plate elements are pointing downwards then the "top" face will actually be at the bottom and the "bottom" face will actually be on top.
Contour range
If you wish to display the full range of contour values, ensure that the "Full range" option is ticked. If not, you can "zoom in" on a particular range of contour values by unticking the "Full range" option and specifying upper and lower limits. Values that fall within the upper and lower limits will be colored depending on where they fall within the specified color spectrum, and any values that fall outside the limits will be given the same color as values that fall on the upper and lower limits. If you find that the contour diagram is predominantly showing the "middle" color, you may be able to display more color detail by setting a narrower contour range.
The colors in a contour diagram can be changed by double-clicking any of the three color icons and then selecting the desired color, or by clicking the "Color Picker" button.
Labelling
Each plate can be labelled with its contour value if desired.
Contour levels
The contour levels is the number of color steps used if smoothing is turned on and continuous smoothing is off. The contour levels setting also controls how many colors are shown in the contour legend, even if smoothing is turned off or continuous smoothing is on.
Value based transparency
If the maximum or minimum stresses, forces or moments in a plate contour are hard to see then value based transparency can help by making the colors at one end of the contour range opaque and the colors at the other end of the range transparent, with a linear or logarithmic distribution in-between. A logarithmic distribution simply makes the effect more dramatic than a linear distribution. Note that value based transparency for plate contours has no effect when in wireframe rendering mode.
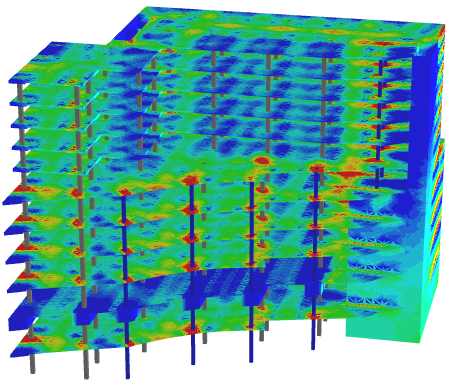
In the following example you can see that there are small areas of high stress shown in red, however some of them are difficult to see because they occupy a small area or are hidden behind other plates.
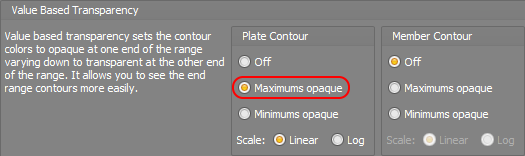
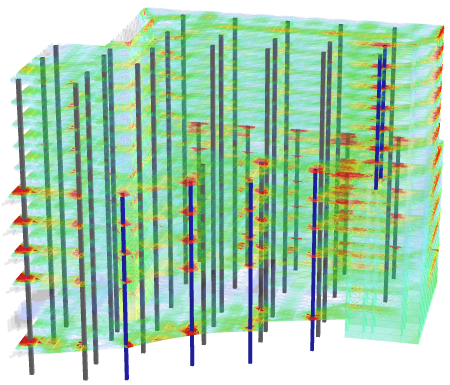
By turning on value based transparency with the maximums opaque they become much easier to see as you can see below.
Note that if value based transparency is turned on then general contouring transparency will have no effect.
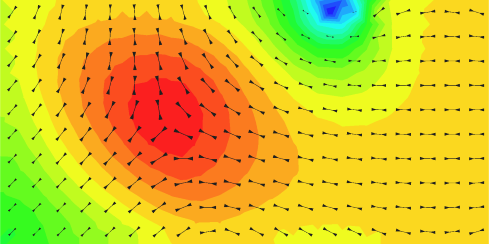
Principal stress vectors
Stress vectors that show the stress flow throughout a slab or wall can be included with the major and minor principal stress contour diagrams. Stress vectors indicate the magnitude of the stress (via the length of the vector), the direction (via the direction of the vector) and the sign of the stress (via the arrow heads on the vector), where <==> represents tension and >==< represents compression. You can change the length of the vectors by rotating the mouse scrollwheel while holding down the V key.
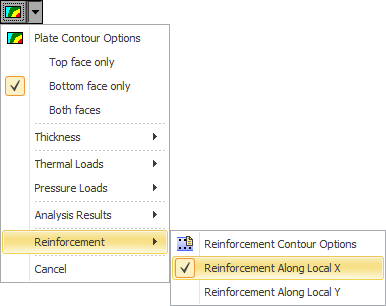
Reinforcement
If you have the reinforced concrete slab design module then reinforcement along the local X and Y directions can be designed and shown as a contour diagram. The reinforcement calculations are based on the settings in the "Reinforcement Contour and Punching Shear Options" form which can be accessed via the "Reinforcement Contour Options" menu item. The settings in the form are explained in more detail in "Finite element method".